%20(1)-B86R08ZzwhPzS6UZbG3mSxRWPCwGwn.png)



The most popular advice about competitive mapping is backwards. Teams are told to collect competitor logos, compare domain metrics, and place everything on a polished chart. That creates a presentation asset, not an SEO decision.
I start with the searcher's problem instead. Which SERP intent are we trying to win, and where does the market boundary begin and end for that searcher? A project management software company, for example, may compete with another SaaS vendor on commercial queries, a review publisher on comparison terms, and a marketplace or forum on evaluation searches. A domain-only competitor list misses that fight.
A useful map connects observable SERP and domain evidence to a choice about content, links, positioning, or budget. The chart is only the surface. The work underneath determines whether anyone can act on it.
Spis treści
- Why Most Competitive Maps Fail Before They Start
- The Five Forces Lineage Behind Modern Mapping
- Anatomy of a Map You Can Actually Use
- The Three Metrics That Drive SEO Decisions
- Building the Map From SERP and Domain Data
- Choosing the Right Map Type for the Question
- Turning Gaps Into a Prioritized Action List
- Keeping the Map Alive After Launch
Why Most Competitive Maps Fail Before They Start
Most maps fail before the first domain is exported. The team defines competitors by reputation or internal opinion, blends unrelated search intents, and never states what decision the map should change. The final slide then shows logos and estimated traffic, but no one knows whether to publish a new page, improve an existing one, pursue links, or ignore the apparent gap.
I've seen this happen when a company treats every ranking domain as an equal rival. A large publisher may rank for informational queries but have no relevance to a product-led commercial page. A niche specialist may own a valuable intent cluster despite having little visibility across the broader category. Both belong in the research, but they shouldn't receive the same strategic label.
The competitor problem
Define the market boundary through a controlled seed set and the SERP intent behind it. Separate commercial investigation, comparison, informational education, navigational demand, and problem-led searches before you collect domains. Then classify what appears:
- Direct rivals sell a comparable solution to a comparable audience.
- Substitutes solve the same problem through a different product or workflow.
- SERP owners control features, directories, marketplaces, forums, or review pages.
- Authority sources shape the topic even when they don't sell the same product.
The competitive landscape analysis techniques resource from Domain Drake is useful when you need a broader competitor-analysis process, but the SEO map still needs a narrower question attached to it.
Praktyczna zasada: If the map can't change a roadmap, budget, or prioritization decision, it isn't competitive intelligence. It's decoration.
The action gap
A decision-ready map should answer one of a few concrete questions. Which content format captures the target intent? Which domains attract links for pages we need to build? Which competitor pages deserve reverse engineering? Which apparent keyword gap is too distant from our product or authority to pursue?
If the answer is just “these are our competitors,” stop. Build the domain list, but don't call it a competitive map until it explains where pressure concentrates and what your team should do next.
The Five Forces Lineage Behind Modern Mapping
Competitive mapping has a clear strategic lineage. Michael E. Porter's Five Forces framework was first published in a 1979 Harvard Business Review article, formalizing rivalry, supplier power, buyer power, the threat of substitutes, and the threat of new entrants as the core dimensions of industry competition. The framework was designed to assess competition at the industry level rather than only at the firm level, which made it useful for comparing pressure across markets and explaining differences in profitability. Porter's framework summary captures that foundation.
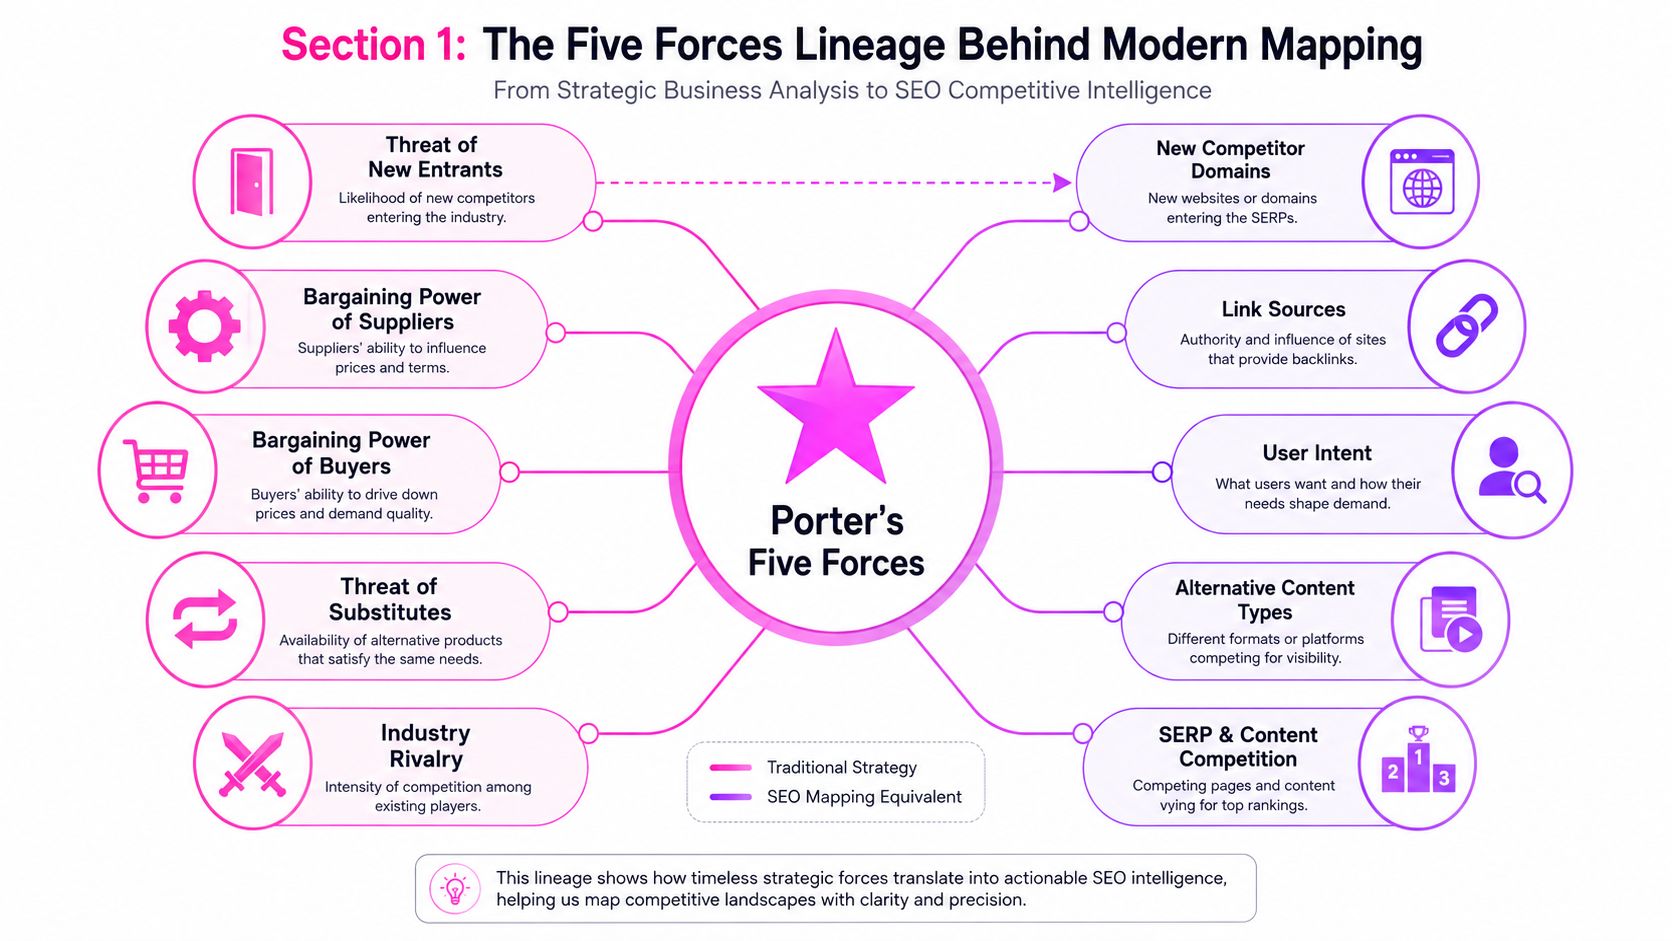
The direct SEO translation is more useful than the historical label. Industry rivalry becomes the set of domains competing for the same intent. Substitutes include alternative content types, such as a comparison page competing with a software directory or a forum thread. New entrants are new domains or newly active publishers appearing in valuable SERPs.
Supplier power also has an SEO counterpart. Link sources, marketplaces, platforms, and distribution partners can influence visibility without ranking as product competitors. Buyer power appears through user intent, review behavior, switching concerns, and the information buyers require before they convert.
Segment the actors instead of flattening them
A single master list hides these relationships. I use separate groups for primary rivals, content substitutes, SERP feature owners, authority sources, marketplaces, and emerging domains. The same domain may occupy different roles across intent clusters, so classification belongs at the query or page level when the market is complicated.
This segmentation prevents a common mistake. A forum that ranks for implementation questions shouldn't be measured like a product competitor, but it may reveal objections your content must answer. A directory may not deserve a product comparison, yet its category page can expose the attributes buyers use to evaluate vendors.
The Five Forces lineage matters because it encourages analysts to map pressure, not just participants. In SEO, that means studying who owns demand, who supplies authority, who shapes the buyer's decision, and which alternatives divert clicks before a commercial page gets seen.
Anatomy of a Map You Can Actually Use
A practical map has five components, and each one earns its place by supporting a decision. I'll use a SaaS company targeting project management software to show how the pieces fit together.
Start with the market boundary
The team might begin with seed queries around project management software, task management, team collaboration, and software comparisons. I wouldn't combine every related term immediately. First, I'd cluster the queries by intent and retain only the clusters connected to the decision at hand, such as commercial evaluation.
The boundary should specify the audience, geography, search engine, device context, and time horizon. Without those constraints, traffic and ranking comparisons become difficult to interpret.
Segment the actors
For the working map, suppose the team identifies ten domains across four actor types:
- Direct SaaS rivals with comparable project management products.
- Content substitutes publishing software comparisons or implementation guides.
- SERP feature owners such as directories, review platforms, or marketplaces.
- Authority sources covering workflows, productivity, or team operations.
The number is an example of map design, not a market statistic. The important point is that each domain has a reason to be present.
Choose dimensions that answer the question
For a content roadmap, I'd use estimated non-branded organic traffic for the selected query set, content depth on relevant topics, and topical authority supported by ranking coverage and referring-domain evidence. For a link plan, I'd emphasize pages by links, referring-domain overlap, and the acquisition patterns visible around high-performing URLs.
A map with too many axes becomes hard to use in a meeting. Choose the smallest set that distinguishes the strategic alternatives.
Use observable metrics
Useful fields include estimated organic traffic, shared keyword count, referring-domain count, ranking URL, intent label, and SERP feature presence. Tool estimates should remain labeled as estimates. Public-company filings can support audited revenue or segment analysis when business scale matters, while private-company comparisons need cautious bracketing rather than invented precision. A repeatable competitor-mapping workflow can use Census County Business Patterns, BLS QCEW, SEC EDGAR, SBA standards, and Census receipts data for that broader market-sizing work.
| Komponent | What It Contains | Typical Data Source |
|---|---|---|
| Market boundary | Seed queries, intent clusters, geography, audience | Keyword research and live SERPs |
| Actor segmentation | Direct rivals, substitutes, feature owners, authorities | SERP review and domain intelligence |
| Decision dimensions | Traffic, topical coverage, links, content format | Domain and page-level reports |
| Evidence fields | Ranking URL, shared keywords, referring domains, SERP features | SERP tools and backlink databases |
| Visual artifact | Bubble map, matrix, or focused comparison | Spreadsheet, BI tool, or SEO platform |
Make the artifact redrawable
The final visual should be simple enough to redraw in a planning meeting. If the team can't explain why a domain sits in a position, the placement is probably subjective. A smaller, evidence-labeled map beats a detailed graphic that nobody can update.
The Three Metrics That Drive SEO Decisions
Domain totals create confidence without necessarily creating insight. I rely on three practical metrics: traffic share for the defined query set, top-page concentration, and keyword gaps. Together, they show who captures demand, which URLs do the work, and where an actionable opening exists.
Traffic share needs normalization
Estimate non-branded organic visits across the prioritized keyword universe, then compare domains on the same geography, device context, index, and date. Don't add ranking positions mechanically when one domain appears multiple times for the same query. A rival with several URLs in one SERP still competes for one searcher's decision, so the opportunity model should account for overlap.
This is narrower than a broad “share of search” narrative. For a useful treatment of the wider concept, Otter A/B's share of search in 2026 provides relevant strategic context. In my maps, however, I keep the calculation tied to the actual intent cluster and the pages that can serve it.
Top pages reveal the real competitor
A domain may look dominant because of unrelated informational traffic. Open its important URLs and inspect the format, intent, internal links, content depth, and referring-domain profile. A single directory page, review article, product page, or comparison guide may account for most of the relevant visibility.
That distinction changes the response. If a rival's demand is concentrated in a comparison page, I study the page's information architecture and link sources. If visibility is distributed across a topic cluster, a single article probably won't close the gap.
Separate keyword gaps by opportunity type
I divide gaps into terms where a competitor ranks and we don't, terms where our page ranks weakly, and terms where no credible domain appears to satisfy the intent strongly. Then I label each gap by funnel stage, business fit, content format, and likely effort.
For example, if three competitors rank for “project management software comparison” through separate affiliate pages, publishing another isolated article may add little. A consolidated comparison asset with clearer product criteria, stronger internal links, and a focused link acquisition plan could be the more rational response.
| Metryka | How to calculate | Decision supported |
|---|---|---|
| Udział w ruchu | Sum estimated non-branded visits across the selected query set and normalize overlap | Which domains deserve strategic attention |
| Top pages | Identify relevant URLs, formats, rankings, and link profiles | New page, update, consolidation, or link work |
| Keyword gaps | Compare competitor-visible and weak-coverage terms by intent and fit | Which opportunities enter the roadmap |
Building the Map From SERP and Domain Data
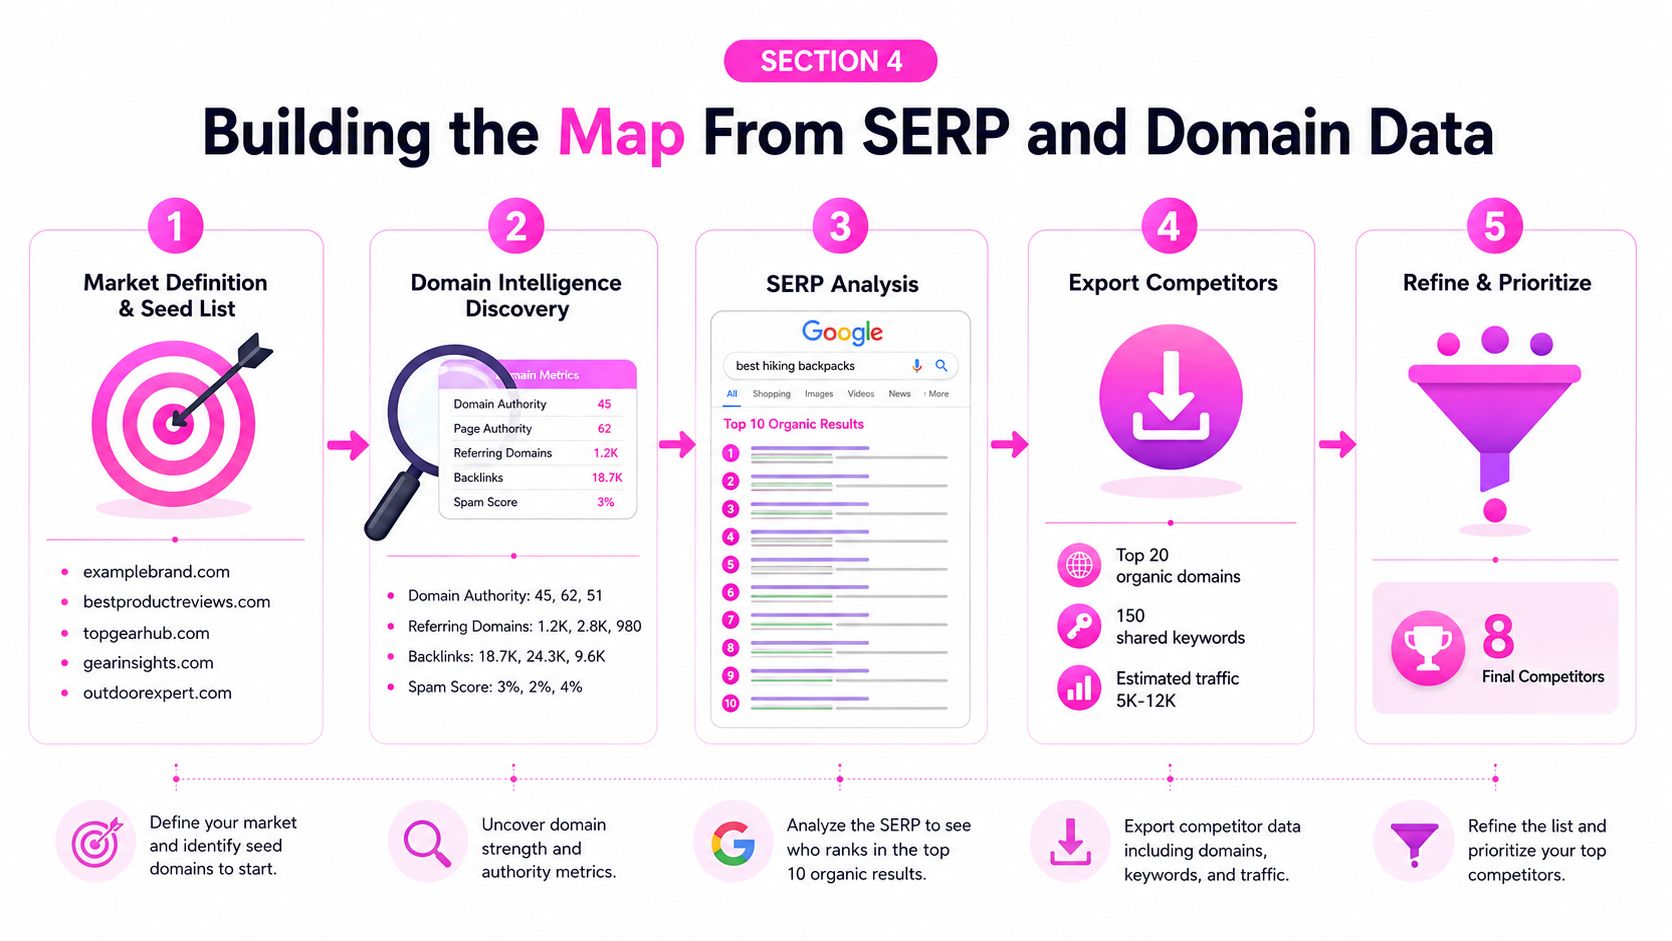
I build the map from two directions because either source alone creates blind spots. Domain intelligence finds broad overlap, while live SERP review confirms whether the overlap is meaningful for the searcher.
Define the query universe
Start with a controlled seed list, not an enormous export. Include head terms, long-tail variations, questions, comparison language, and queries associated with the strongest pages on known rival domains. Cluster the terms by intent before calculating overlap.
For every material query, capture the ranking domain, ranking URL, intent, SERP features, and a note on stability or volatility. I use SERP analysis workflows to keep the query-level evidence connected to the page that ranks.
Discover and classify domains
Export organic competitors, shared keywords, estimated traffic, and top URLs from domain intelligence tools. Deduplicate the results, then review the domains manually. Segment them into direct substitutes, indirect authorities, marketplaces, publishers, and navigational targets.
Don't let a tool's competitor label become your final taxonomy. A domain can be statistically close but strategically irrelevant if the overlap comes from a different audience or a different intent.
Normalize before comparing
Separate branded and non-branded demand. Align geography, device, search engine, index assumptions, and date. Mark third-party traffic figures as estimates rather than audited facts, particularly for private companies.
I also normalize at the URL level. Two domains may rank for the same topic, but one may use a dedicated product page and the other a general blog post. That difference affects the type of asset we should create and the internal-link structure required to support it.
Extract gaps and acquisition patterns
I usually label gaps as:
- Competitor-visible, a rival ranks and our site doesn't.
- Weak-coverage, our site appears but doesn't satisfy the intent fully.
- Unclaimed, no credible incumbent clearly owns the query.
- Share-of-voice, several rivals repeatedly appear across the cluster.
Then connect each domain to its important pages, ranking topics, and likely acquisition patterns. Referring-domain overlap can reveal link prospects, while page formats show whether the market favors guides, directories, reviews, templates, or product pages.
For large-scale collection, the benefits of scraping APIs include more repeatable extraction and structured monitoring, but automation doesn't replace validation. A malformed result, personalization, or changed SERP layout can distort the map if nobody checks samples manually.
Choosing the Right Map Type for the Question
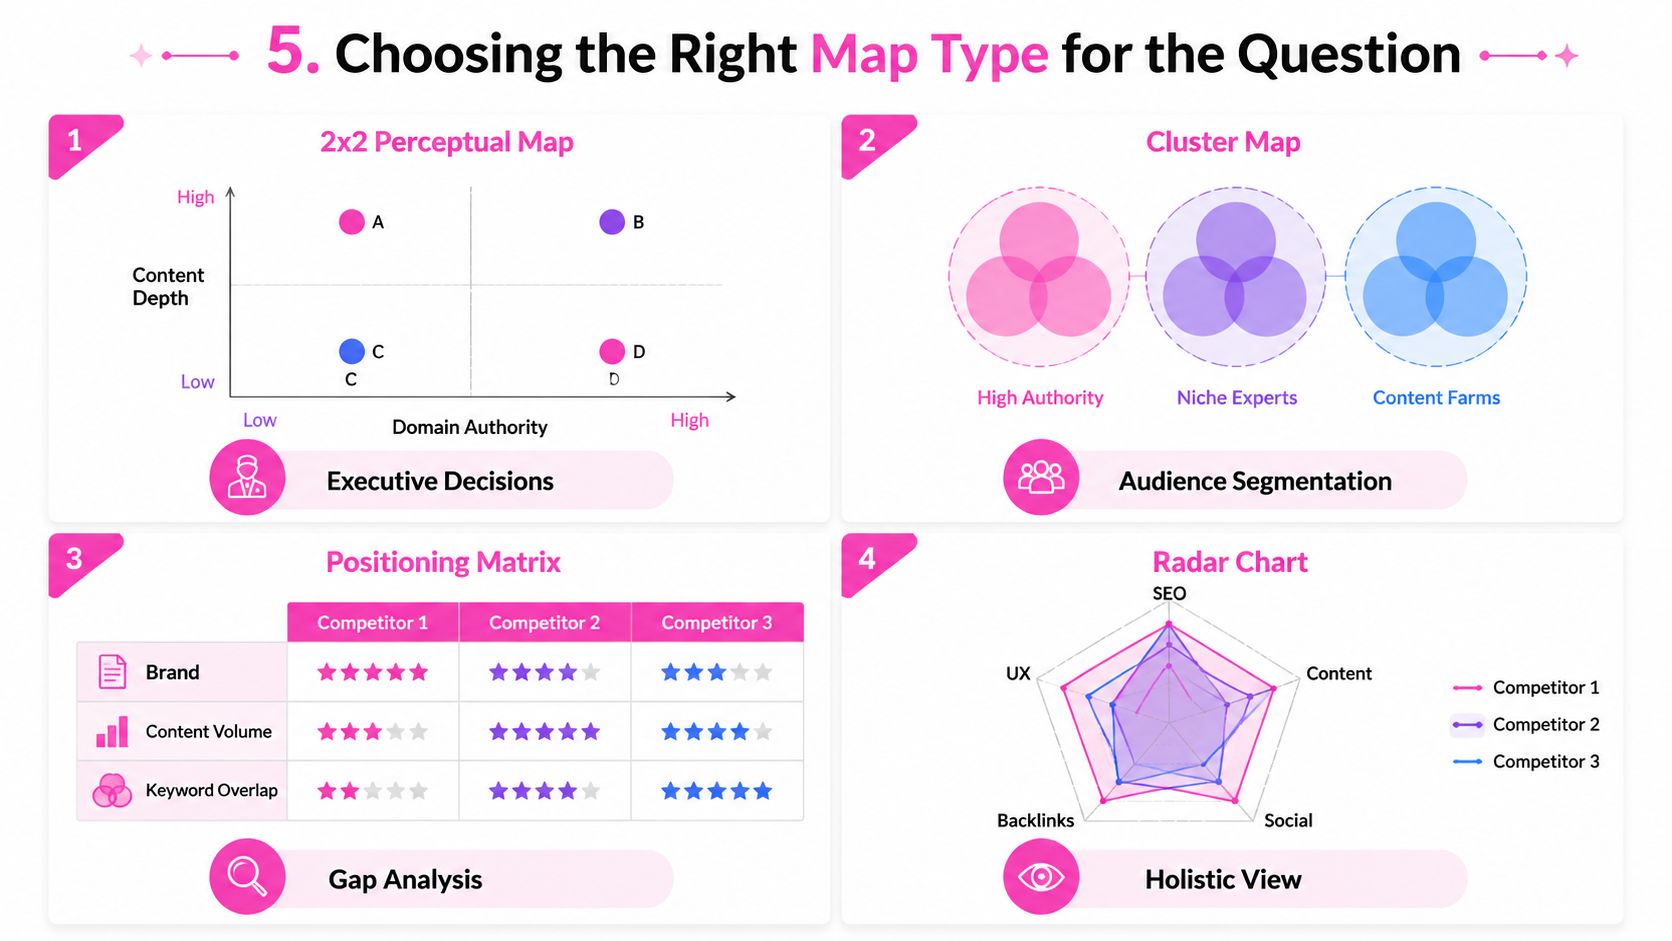
The visual format should follow the decision, not the other way around. A 2×2 map is familiar and quick to explain, but it can imply a level of measurement the evidence doesn't support. A matrix looks less impressive, yet it often helps an SEO team choose work faster.
Use a 2×2 for positioning questions
Plot domains against two buyer-relevant dimensions, such as content depth and topical authority. The classic method works only when the axes reflect actual purchase or search criteria, and placements rely on evidence such as pricing, feature comparisons, customer ratings, or ranking coverage. Guidance on perceptual competitive maps makes that principle explicit.
I use this artifact for executive conversations about positioning. I don't use it to decide which page to publish, because broad scores can hide the query-level details needed for execution.
Use bubbles for ecosystem structure
An ecosystem bubble map is better when distribution and category control matter. Size bubbles with an evidence-based metric, place them by audience or intent, and include publishers, marketplaces, platforms, distributors, and standards bodies where relevant. The result shows whether pressure clusters around direct brands, review sites, or gatekeepers.
Use a keyword matrix for production
The keyword gap matrix is usually the most operational format. Rows represent domains, columns represent prioritized queries, and cells contain rankings, visibility, or a clearly defined score. Group columns by intent or funnel stage so a large but unattainable head term doesn't overshadow a commercially relevant long-tail cluster.
Pair the matrix with a top-page map when the decision is whether to create, update, redirect, or consolidate. If the only conclusion is that certain domains occupy the SERP, a simple competitor list is more honest than a chart.
Turning Gaps Into a Prioritized Action List
A raw gap list isn't a strategy. I turn it into an opportunity queue by scoring three signals: traffic potential, competitive intensity, and strategic fit. The formula is:
Opportunity score = traffic potential × strategic fit ÷ competitive intensity
Traffic potential can use estimated click-through rate multiplied by monthly search volume. Competitive intensity can reflect the number and strength of ranking domains, while strategic fit captures relevance to existing product pages, audience needs, and the authority we can realistically build.
Use the score to sequence work
I don't automatically lead with the largest search volume. A high-volume term dominated by entrenched domains may consume research, production, and link resources without helping the site's near-term position. A smaller long-tail gap with clear product relevance can create a stronger base for later mid-funnel work.
A practical sequence often looks like this:
- Quick-win coverage: Improve weak pages and address tightly aligned long-tail gaps.
- Mid-funnel expansion: Build comparison, use-case, and evaluation assets supported by internal links.
- Authority projects: Pursue difficult category terms only when the site has evidence, coverage, and acquisition capacity.
- Consolidation: Merge overlapping pages when several weak assets target one intent.
Użyj analizy luk w treści to connect competitor-visible terms with page-level opportunities rather than treating every missing keyword as a new URL.
Match effort to expected lift
| Signal | Weight | Low (1) | Medium (2) | High (3) |
|---|---|---|---|---|
| Traffic potential | Wysoki | Limited relevant demand | Meaningful cluster demand | Strong relevant demand |
| Competitive intensity | Wysoki | Few capable incumbents | Mixed ranking field | Strong incumbent control |
| Strategic fit | Wysoki | Weak product connection | Usable with adaptation | Direct product and audience fit |
The table is a decision aid, not a claim of precision. Record why each score was assigned, identify the evidence behind it, and review the assumptions before committing budget.
Keeping the Map Alive After Launch
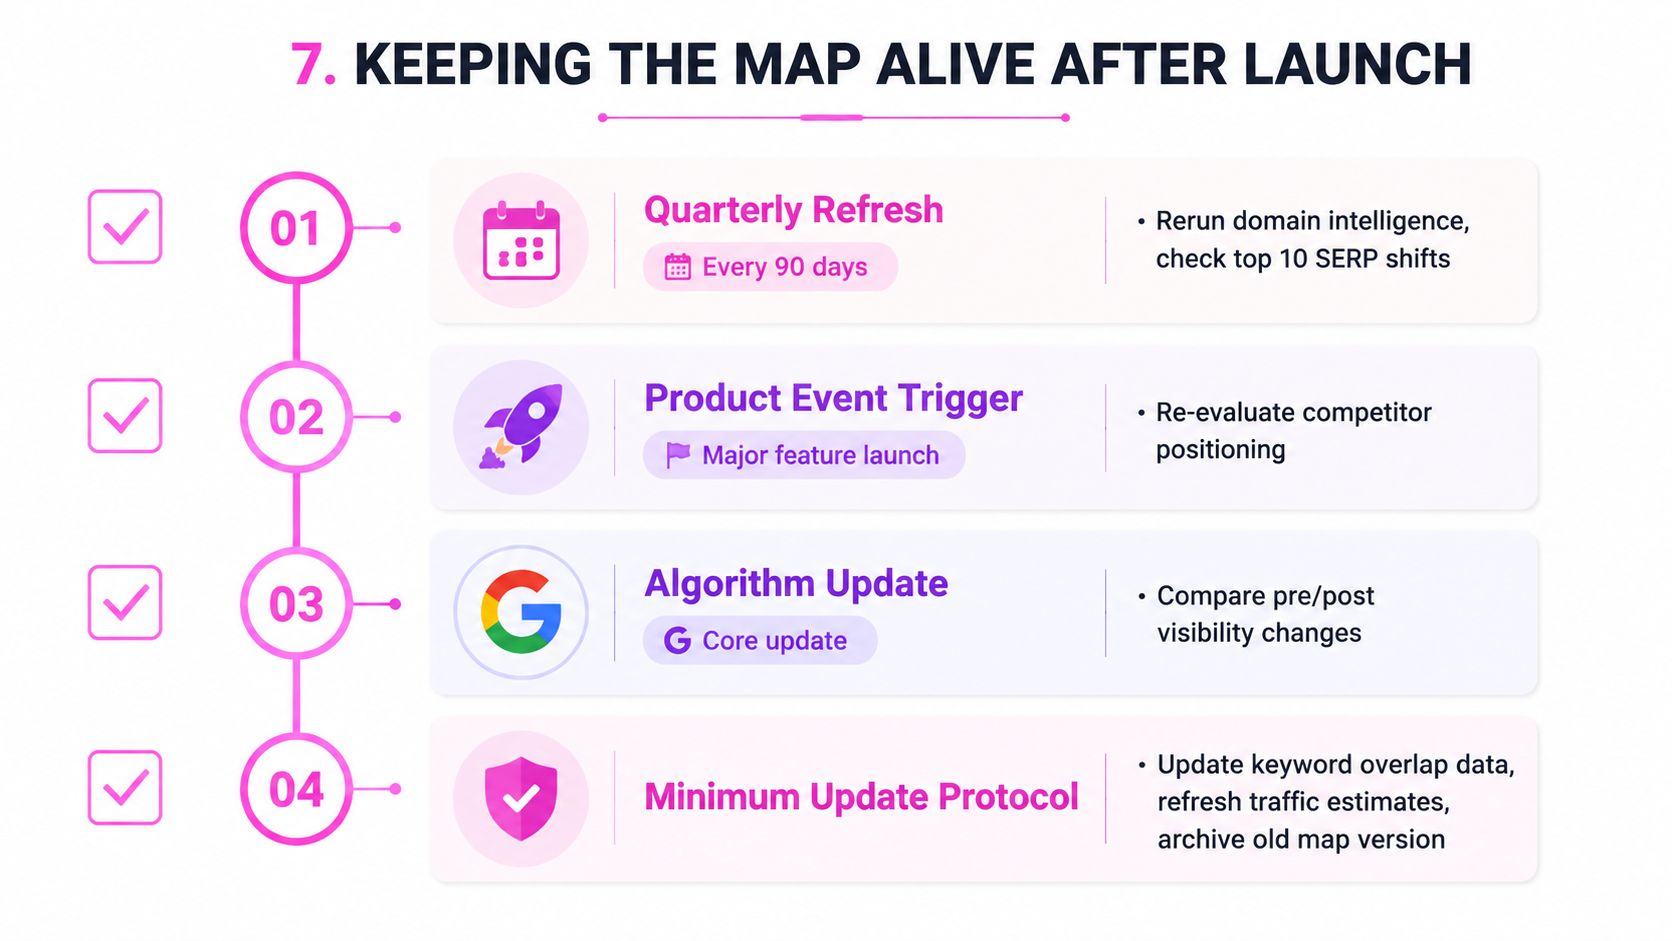
A competitive map starts decaying as soon as it ships. New domains enter the SERP, existing rivals publish pages, product launches change positioning, and algorithm events alter which formats receive visibility. A static quarterly slide can't represent those changes unless the underlying dataset gets refreshed.
I recommend a 90-day refresh cadence, supported by event-based reviews. Re-run the keyword gaps, recompute the selected traffic-share view, and inspect new SERP entrants. Refresh sooner after a major Google core update, a substantial product launch, or a significant content release from a named rival.
Prevent the expensive failures
Three post-launch habits cause the most damage:
- Frozen competitor sets: Keep discovery open so newly visible domains can enter the review.
- Drifting visuals: Regenerate charts from the current data rather than editing labels by hand.
- Vanity reporting: Send the findings into editorial, digital PR, and link-planning meetings.
The map should remain connected to shipped work. If a competitor's top page changes format, the content team should know. If a rival gains links from a recurring source, the outreach team should assess the pattern. If intent shifts, the page brief should change before production begins.
Separate static and recurring artifacts
Keep the market definition, taxonomy, scoring rules, and field definitions relatively stable. Regenerate keyword overlap, ranking URLs, SERP features, traffic estimates, top pages, referring-domain comparisons, and entrant lists on each refresh.
That balance preserves comparability without freezing the market. A versioned archive also helps explain why priorities changed, which prevents the next planning meeting from treating old assumptions as current evidence.
SemDash brings domain, page, keyword, backlink, and SERP data into one research workspace, including competitor domains, top pages, traffic share, keyword gaps, backlink gaps, and SERP history. Visit SemDash (SemDash) to turn your competitive landscape map into a repeatable workflow for content prioritization and link acquisition.